neoCateem
Online EEG based Neuro-Imaging Software
- Product No: NS-1030
- Manufacturer: NeuroCode
- EEG FFT
- Accessories
- Request Quote
Description
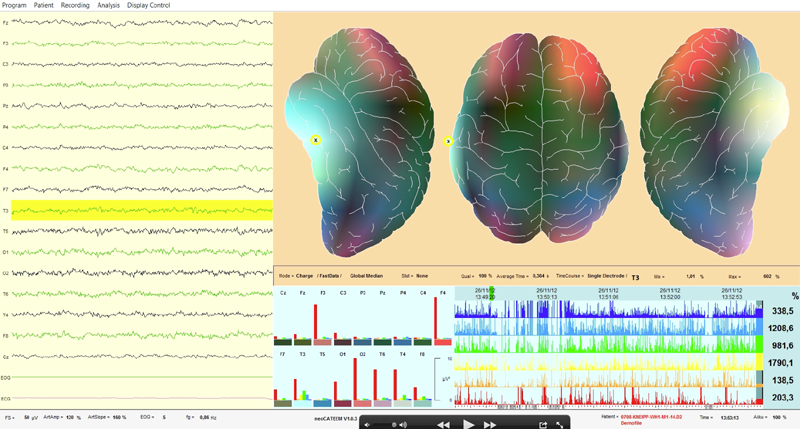
Analysing the electrical activity of the brain (the so-called language of the brain) can shed light to its underlying mechanisms. However, raw signal alone without analysis is not informative. Instead, quantitative frequency analysis using Fast Fourier Transformation (FFT) provides a useful tool to characterize the activity of the brain in detail. neoCateem, an EEG based neuroimaging software, translates the results of regional electrical activity into spectral colours and displays all frequency changes within one map, which corresponds mathematically to a 64 channel EEG. This processing results in enkephaloglyphs which represent spectral signatures of electrical brain activity under various recording conditions.
Through using neoCateem Software, enkephaloglyphs are related to cognitive and emotional states of the brain. They are subdivided into four categories depending on the application field: Electropsychogram (Advertisement Research), Electropathogram (Medical Diagnosis), Electropharmacogram (Drug Action) and Electrohypnogram (Sleep). Thanks to recent progress in software development, various states of the brain can be analysed within a time window of less than 0.4 seconds (about 3 pictures / second).
neoCateem EEG-based Neuro-Imaging
Computer-aided on-line construction of electric brain maps allows you to follow brain activity in real time. The software package CATEEM - developed with proprietary computer systems about 20 years ago has now been translated to run under the operating system Windows as neoCateem. Nearly 3 maps per second are delivered during mental activities. This allows psychophysiological research in combination with eye tracking as well as for neurological diagnosis.
neoCateem in Pharmacology
For about 20 years, quantitative assessment of drug action has been followed by using CATEEM. In Pharmacology, neoCateem calculates spectral frequency changes in different brain regions and evaluates these using a linear discriminant analysis (17 brain regions x 6 frequency ranges = 102 variables). The results are displayed by means of a 6-dimensional plot: Result of the first three functions is coded into space (x, y and z axis), results from following three functions into color (RGB mode like used in TV). Drug action is discriminated according to differences in change of spectral frequencies as determined by source density evaluation of the quantitative EEG (Results from this type of assessment correspond to those of Magnetencephalography). Related drug action is recognized in close proximities and color (this evaluation is not a part of the commercially available software package). During clinical studies, dose as well as time-dependent changes of electrical brain activity can be monitored.
neoCateem Tracking Module
Neurocode Tracking Module enables fast and dynamic EEG recording in combination with eye tracing. Exact synchronization with eye tracking allows for quantitative evaluation of the reaction of the brain to single gazes. Importantly, not only conscious but also subconscious processes are evaluated. For more information please visit NeuroCode Tracking Software.
neoCateem in Market Research
The method of brain mapping with Enkephaloglyph allows a precise EEG analysis during an eye-gaze on a TV commercial. The high time resolution quantitative EEG enables us to set up a library of enkephaloglyphs of brain electric activity related to individual mental reactions (memory!) as well as emotions. For more information please visit NeuroCode Tracking Software.
Software Features
- Pattern of all frequency changes is documented within one single map.
- Highest time resolution is sweep length of 364 ms to produce one map.
- Online moving average possible up to 3 minutes for neurological research applications.
- Automatic comparison of 102 EEG parameters to data-base containing hundreds of healthy brains.
- Data recorded and documented in a voltage mode or surface charge mode.
- Source Density, results correspond to MEG.
- Power within six specially defined frequency bands reflects changes of particular neurotransmitter action.
- Continous measurement of depth of sleep by a patented algorithm.
- Can display Topographical online real-time representation.
- Chronology of the frequency changes.
- Electrical power in uV2 or as global median presented as bargraph for each electrode.
Please note: Important! This product is for research applications only. Not a medical device as defined in EU directive 93/42/EEC. Not designed or intended to be used for diagnosis or treatment of disease.

